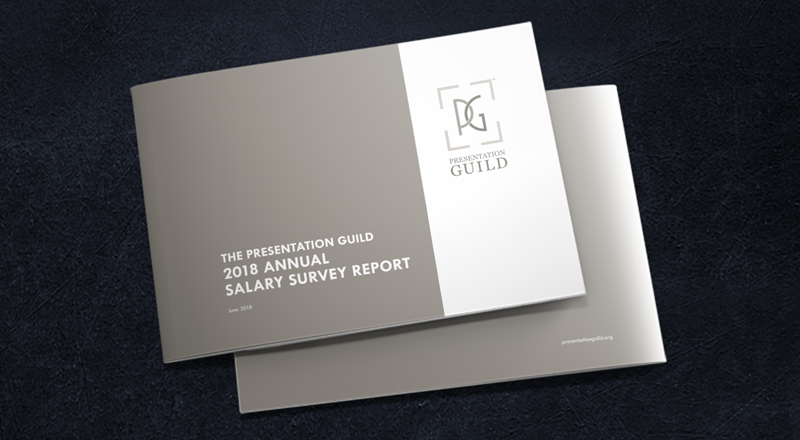
Things are looking good in the world of presentation professionals.
That’s the top takeaway from data in our annual survey of the salaries, demographics, and work habits of presentationists. While this is our second such survey, it’s our first to include data from all over the globe.
Key stats:
- We received 204 responses
- 56% of us are between 36 and 55
- 55% of us are female
- We average 16.5 years of experience
- Almost 34% of full-timers (employed or self-employed at 35 hours per week or more) earn US$50,000-75,000 a year
- 31% of full-timers earn US$75,000-150,000 per year
- Among the self-employed, most of us bill an hourly rate in the US$50-150 range
- We are a fairly educated lot – three fourths have a bachelors degree or higher
- Unlike the graphic design world, the presentation world exerts little or no bias in annual earnings across gender
New to this year’s annual report: Correlations
- Salary and gender
- Salary and education
- Salary by global region
- Experience and age
You will want to see these numbers and graphs, trust us. It is the context and the benchmark for what we do and how we do it on a daily basis. See for yourself how far you have come, where you can go, and who is with you on your journey. This is a bigger, better annual report. It’s the stuff you want to know.
You can download a free copy if you are a Guild member. (You are also entitled to a free copy if you were one of our 204 respondents, regardless of your membership status; there was an optional field in the survey form to provide us your email address.)
Members: make sure you’re already logged in to our site and click here. Scroll down to the button “DOWNLOAD 2018 SALARY SURVEY.” Before you click it, note the other downloadable documents on that page. Take advantage of these great resources at any time.
Not a member? This report is available for US$69. Earn major savings if you combine your purchase of the report with a purchase of one year of membership. The report plus one year of membership is only US$99.

